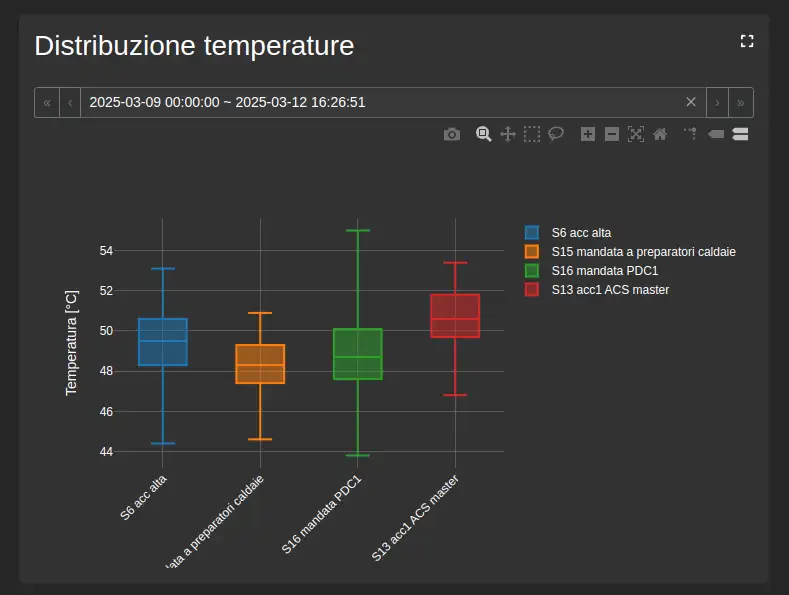
Box plot
Compares the distribution of values from multiple variables. It highlights the position, spread, and unusual values of each series, making differences and outliers in the selected interval easier to identify.
Configuration
This widget uses variable selection, the time range, and series options. Specific settings define the value-axis title.