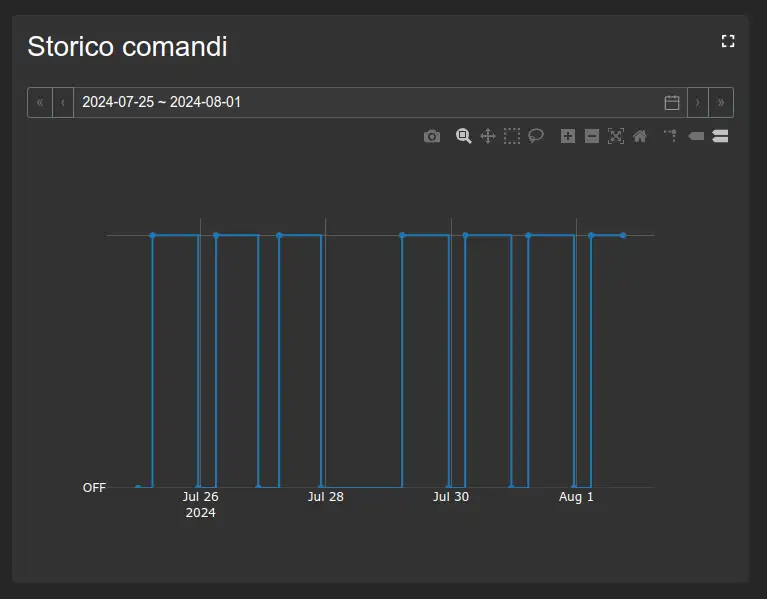
Sequence of events chart
Plots the state changes of Boolean variables over time. It simplifies comparisons between signals and analysis of the order in which events occurred.
Configuration
The chart uses variable selection and a time reference to determine when event loading starts.