Real-time values chart
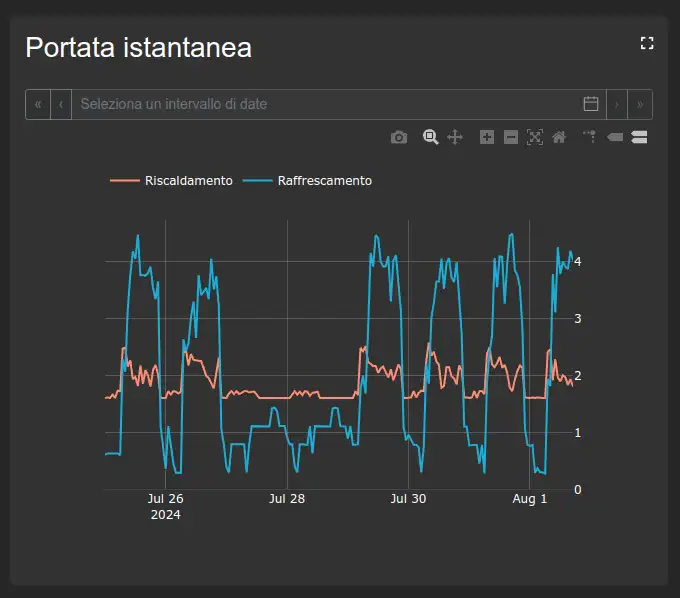
Displays one or more variables over a time range. It is suitable for real-time monitoring and comparing measurements; plotted series can also be calculated from other variables.
Its configuration includes variables, time range, line options, vertical axes, and events to overlay on the chart.
Configuration
This widget uses the following common settings: