Common widget settings
Many widgets share the same settings for selecting data and defining its presentation. This page documents those settings once; each widget page links only to the relevant sections and documents its specific options separately.
The available tabs and fields vary according to the widget type.
Data
The Data tab defines the sources and period to process.
- Variables: displays the selected variables and opens the resource selector.
- Interval from: defines the start of the period.
- Interval to: defines the end of the period.
- Aggregation interval: divides the period into intervals over which values are calculated.
- Time zone: establishes the time reference used by the widget.
- Aggregation type: defines the calculation applied to the values in each interval.
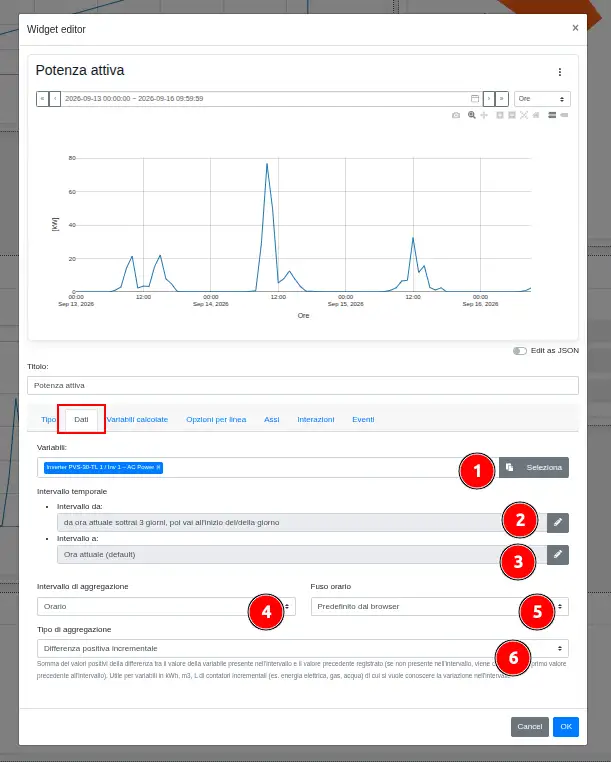
Selecting variables
Click Select to open the resource tree, then choose one or more variables. Depending on the widget, the selector may allow a single or multiple selection.
Selected variables are displayed as labels in the field and can be removed before saving the configuration.
Time range
The pencil buttons beside Interval from and Interval to open the Dynamic time indication selection window:
- choose the time reference type, such as a relative or absolute date;
- specify the starting point, normally the current time;
- add or subtract a number of seconds, minutes, hours, days, weeks, months, or years;
- move the result to the start or end of the selected period;
- use Add action to chain multiple operations;
- confirm the configuration.
The preview at the bottom displays the date and time produced by the configured operations.
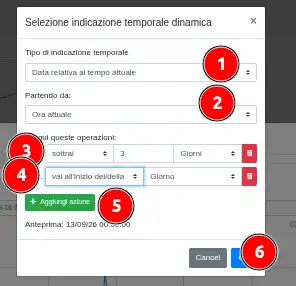
A relative range is recalculated from the time at which the widget is displayed. An absolute range retains a fixed date and time.
Aggregation interval
The aggregation interval defines the size of each time group. Options can include quarter hour, hour, 8 hours, day, week, month, year, or the entire period.
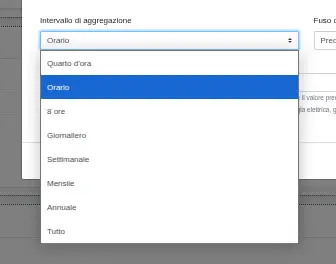
A smaller interval provides more detail; a larger interval produces a more compact summary. Available options depend on the widget and selected period.
Time zone
The time zone determines how time intervals are divided and displayed. The default setting uses the browser time zone.
Aggregation type
The aggregation type specifies the calculation performed on the samples in each interval, such as average, minimum, maximum, or difference.
Learn more
See Aggregation types to learn about the meaning and use of the available methods.
Calculated variables
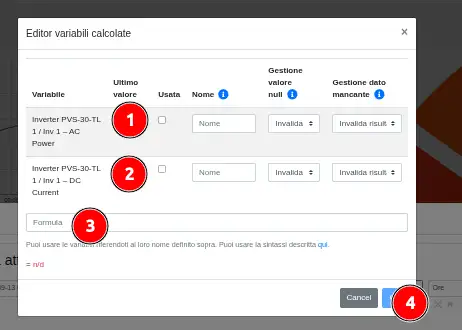
The Calculated variables tab creates a new series by mathematically combining variables selected in the Data tab. Click Add calculated variable (1) to begin.
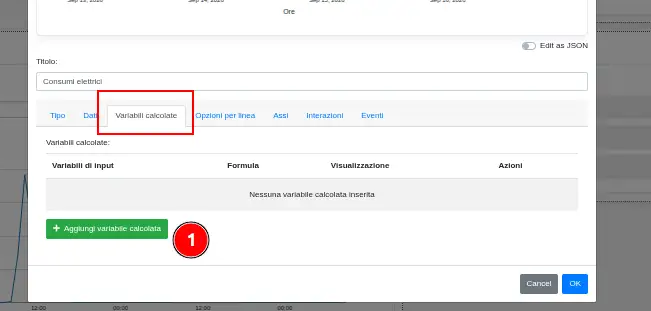
In the editor:
- select the input variables to use, assign each one a name, and define how
nullvalues and missing data are handled; - repeat the configuration for the other required variables;
- enter the formula using the names assigned to the variables;
- confirm to add the new series.
The latest value of each variable helps verify the formula; the preview below the field displays the result or reports an invalid formula.
Learn more
See Formulas for supported syntax, operators, and functions.
Line options
The Line options tab customizes how individual series are presented:
- Color: assigns a color to the series;
- Label: replaces the name shown in the chart and legend;
- Order: sets the position of the series relative to the others.
When available, Repeat in loop cyclically reapplies the list of settings to subsequent series.
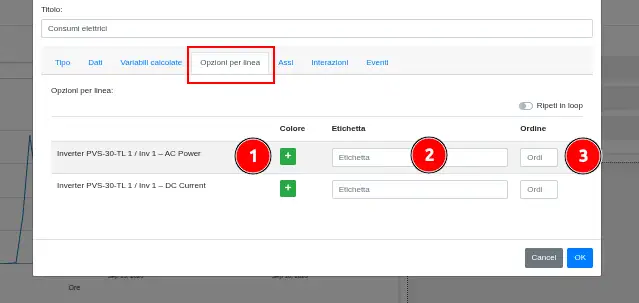
In other widgets, this section may have a different name or include additional properties such as associated axis, fill, icon, visibility, or permission to edit the value.
Axes
The Axes tab configures the axes used by the chart:
- set the axis color and title;
- choose the side on which the axis is displayed;
- use a fixed range or include zero in the automatic range;
- select the value format;
- apply a multiplier to displayed values;
- add another axis when the widget supports multiple scales;
- include the current aggregation interval when required, even if it is not yet complete.
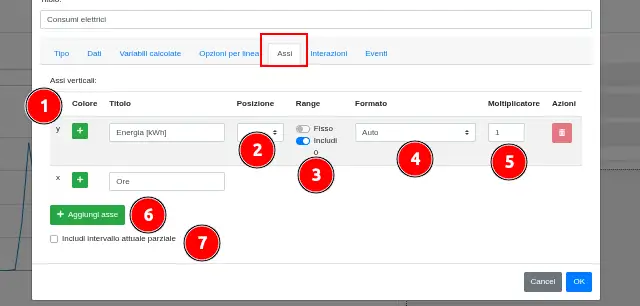
The available options can differ between time and value axes.
Interactions
The Interactions tab controls which tools are available when viewing the widget:
- enable or disable time-range and aggregation-interval selection;
- restrict the aggregation intervals that the user can select;
- define the default cursor behavior on the chart.
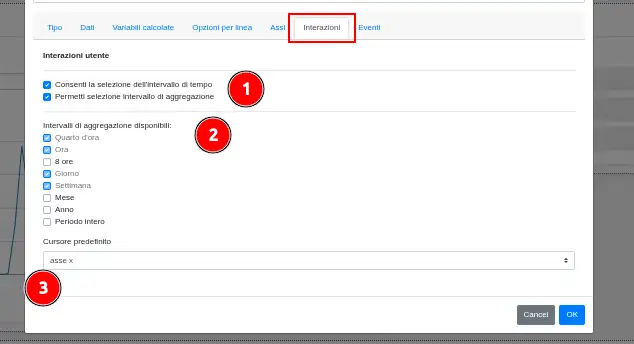
These settings change the viewing experience without changing the source variables.
Events
The Events tab displays events entered in the log during the time range shown by the chart.
- In the Maintenance field, click Select and choose the resources used to filter log events.
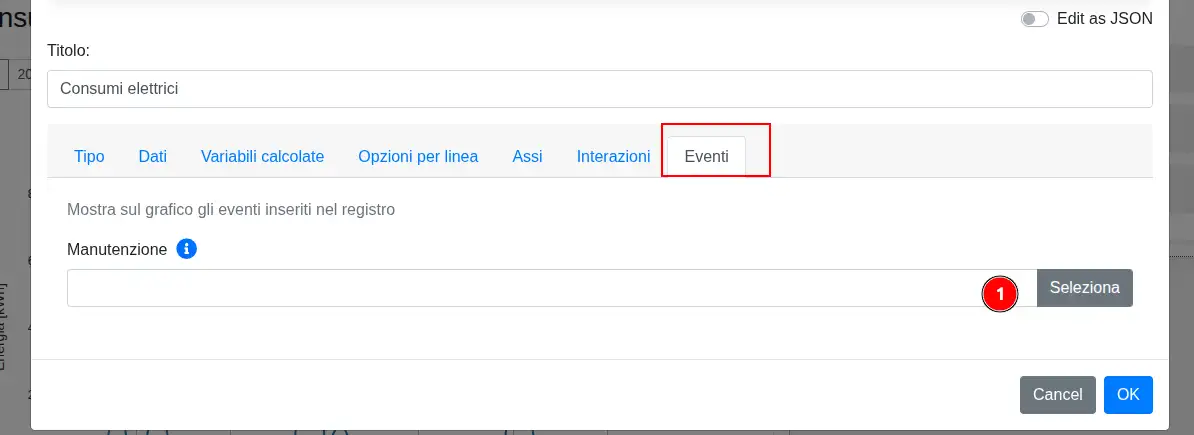
The widget loads events associated with the selected resources and occurring within the chart's time range. Each event is represented by a vertical line: hovering over it displays the description, while clicking it opens the log at the corresponding event. The tab is available in chart widgets that support this function.