Sankey diagram
Displays flows between nodes over a selected period. The width of each link is proportional to the quantity represented by its associated aggregated variable.
It is suitable for energy balances, consumption distribution, and representing process inputs and outputs.
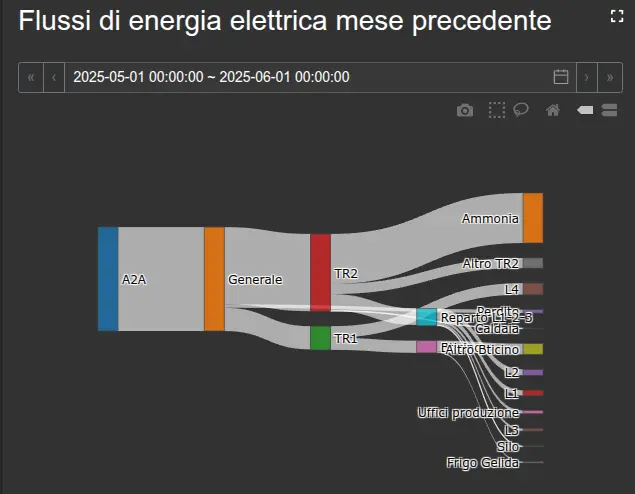
Configuration
Flow values use variable selection, the time range, and an aggregation type. Nodes, links, direction, and colors are specific to the diagram.
Nodes
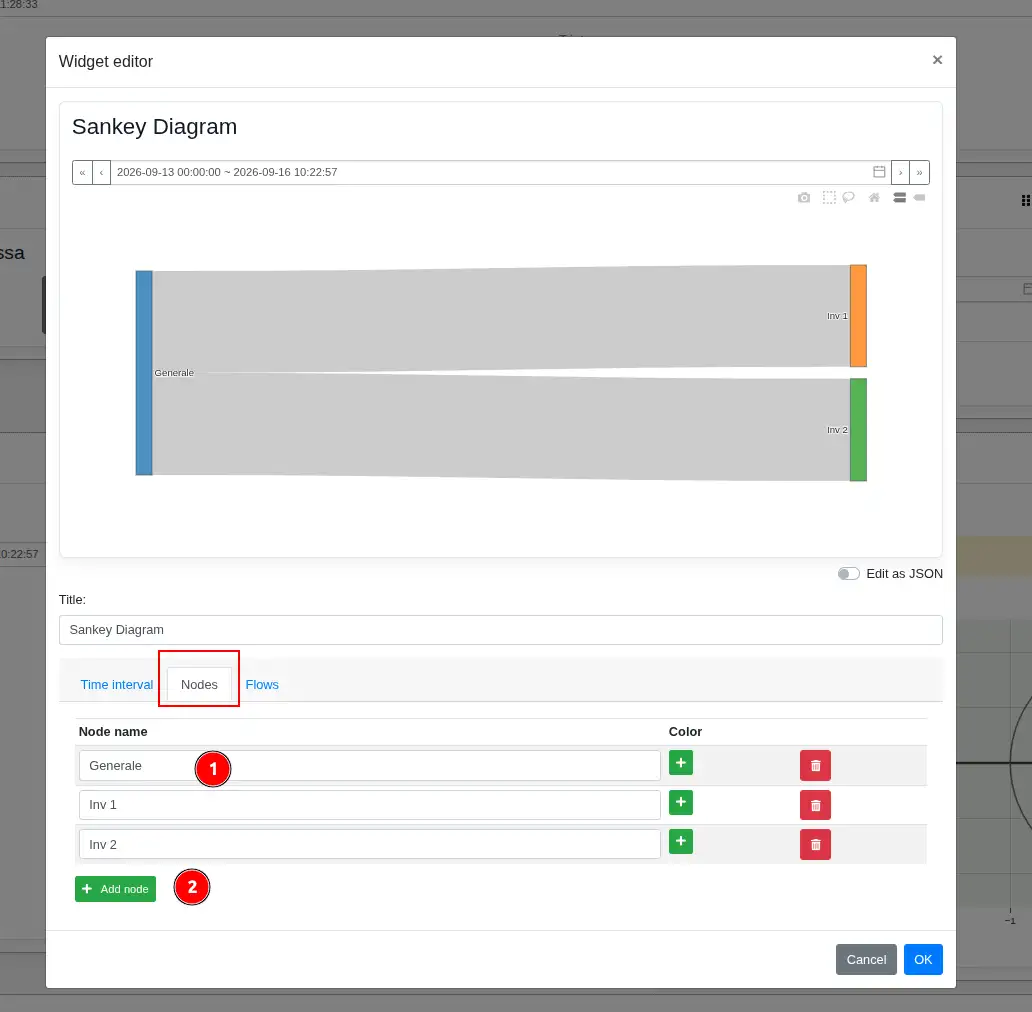
- For each node, enter the name displayed in the diagram and optionally assign a color. The trash button removes the node.
- Add node creates a new source or destination point for flows.
Flows
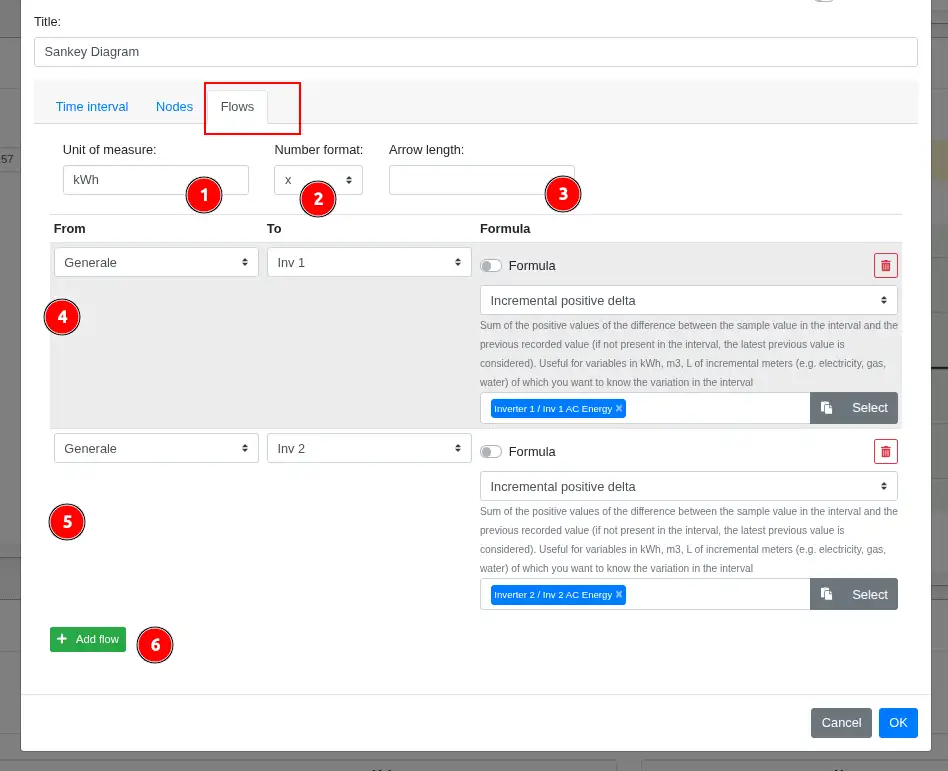
- Unit of measure defines the suffix displayed with flow values.
- Number format sets the number of decimal places displayed.
- Arrow length sets the arrowhead length on links; leaving the field empty uses the default representation.
- For each flow, From and To select the source and destination nodes. Its value can be obtained by aggregating a variable or, by enabling Formula, calculated from multiple aggregate values.
- Each flow is independent and can connect different nodes and data; the trash button removes the corresponding flow.
- Add flow creates a new link.